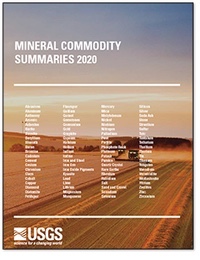
 Last week, USGS released its 43rd Mineral Commodity Summaries – a comprehensive snapshot of global mineral production which gives us a window into where we stand as a nation in terms of mineral resource security.
Perhaps most instructive from an ARPN perspective is the chart depicting U.S. Net Import Reliance — previously casually referred to as “Page 6,” on our blog, but now moved to “Page 7.” Maybe we’ll just call it the Blue Wall of Dependency, based on the many blue bars showing 100% import-dependence — which is down one from 2019 (a quick look into the footnotes of our favorite chart reveals that this is owed to Thorium being added to the category of metals and minerals for which “not enough information is available to calculate the exact percentage of import reliance”), but still totals 17.
As followers of ARPN know, we have seen some incremental progress towards reducing our mineral resource dependencies, and particularly our over-reliance on metals and minerals from China, over the past two years. However, meaningful changes will take time.
There is a slight overall decrease in the number of metals and minerals for which we are 50% or more than 50% import-dependent — an area where we are down from 49 to 47. However, this drop, too, must be taken with a grain of NaCl. For example, whereas in previous reports, iron oxide pigments were separated into two separate categories (natural and synthetic), these were combined into one category for the 2020 report. Arguably significant drops can be noted for our dependencies for foreign supplies of Lithium and Aluminum (to >25% for Lithium and 22% for Aluminum). And while our import reliance for Nickel has dropped to 47%, we are now dependent at a rate greater than 50% for Magnesium compounds. Also notable, our reliance for Cobalt — a critical component of Electric Vehicle battery technology — has gone up from 61% to 78%.
Once more, our favorite chart underscores that much remains to be done to reduce our mineral resource dependencies. China continues to be the elephant in the data room, and is listed 25 times as one of the major import sources of metals and minerals for which our net import reliance is 50% or greater.
On a positive note, the 2020 Mineral Commodity Summaries notes that domestic metal mine production has increased to $28.1 billion, which is almost $500 million higher than in 2018. Perhaps most encouraging, a significant increase in domestic production has occurred in the Rare Earth mineral concentrates segment, where USGS notes that “the domestic production of critical rare-earth mineral concentrates increased by 8,000 metric tons (over 44%) in 2019 to 26,000 metric tons, making the U.S. the largest producer of rare-earth mineral concentrates outside of China.” Yet all of the U.S.-produced rare earths concentrate was exported to China for separation into individual rare earth elements, since that portion of the supply chain doesn’t exist in the U.S.
Hopefully, these findings provide fresh impetus for mineral resource policy reform, for which we have seen incremental progress since 2018.
To read the full USGS report, click here.
For previous iterations, click here.


